What is Code Coverage?
Conventionally, code coverage used to denote the percentage of target code covered through the execution of unit tests. These unit tests in most cases are written majorly by the developers themselves. Also, it does not guarantee the stability of the system as a whole since they concentrate on modules separately and not in an integrated fashion which is totally unlike a situation on the live production environment.
However, in the recent past, several tools have emerged in the market that can provide metrics on functional code coverage, i.e., when functional (black-box) tests are executed on the system as a whole. Seems to be a little conflicting though, that the "black-box" tests provide a white-box view of the code within.
This post focuses on this very Functional code coverage (for a JS-based web app), which is relatively new in automation.
Functional Code Coverage
What metrics or reports do you share with your team/manager after completing your regression test suite, automated test scripts, etc.?Probably the answer is -
- number of tests executed,
- number of failed tests,
- number of issues found and their severity,
- details on features that were tested,
- environment related information (platform, browser, etc.)
What if you can report on how much of the source code was traversed/touched while executing your manual/automated tests on the target app, wouldn't that be great ?
Let's first understand and know some of the great benefits from functional code coverage, and then move on further to implement it in your project.
Why Code Coverage?
- Provides feedback on the quality of test cases
- quantifiable metric to measure quality
- facilitates in identifying redundant cases
- Validates the intent of the tester (character certificate)
- confirms whether tester has the right intent to verify functionalities, or
- just portray more effort than actually put in (corollary of previous point)
- Backtracking
- helps to identify features and/or scenarios you would have missed in your original set of test cases
- helps to identify and thus eliminate unused files and/or dead code
- prevents untested code being deployed to production
- Measuring progress and adequacy of tests
- Obtaining minimum number of tests that provide maximum coverage
Istanbul vs JSCover
You can find many articles and posts on the web already written on this topic, so let's not waste much time in detailing what the 'web' already knows!!Istanbul for browser-side code coverage
As mentioned here on the official Github page of Istanbul, one of the use cases is instrumentation of files for browser tests. However, the coverage information of files executing through a web app on a browser is stored in its local storage. To capture the same, some additional as well as different steps need to be followed as compared to API functional code coverage (which is comparatively easier and straight-forward).
What acted as a guiding step towards success is the step-by-step logical flow mentioned here by the Istanbul developer himself almost 5 years ago. Still, till date, there has not been much documentation around code coverage for tests executing manually and/or through automation tools (like Selenium) on an instrumented web app.
Now, let us understand the steps used to implement in a real scenario of a web app with few screenshots to provide more clarity.
Steps to implement
Following steps were implemented on a Windows 8 machine -- Install node and npm
- Get your source target code in a local directory (probably by cloning from Git)
- Find the file from your source code that has access to your browser's window context, i.e, the "window" object. For example, "app-run.js" in our sample project contains access to $window object.
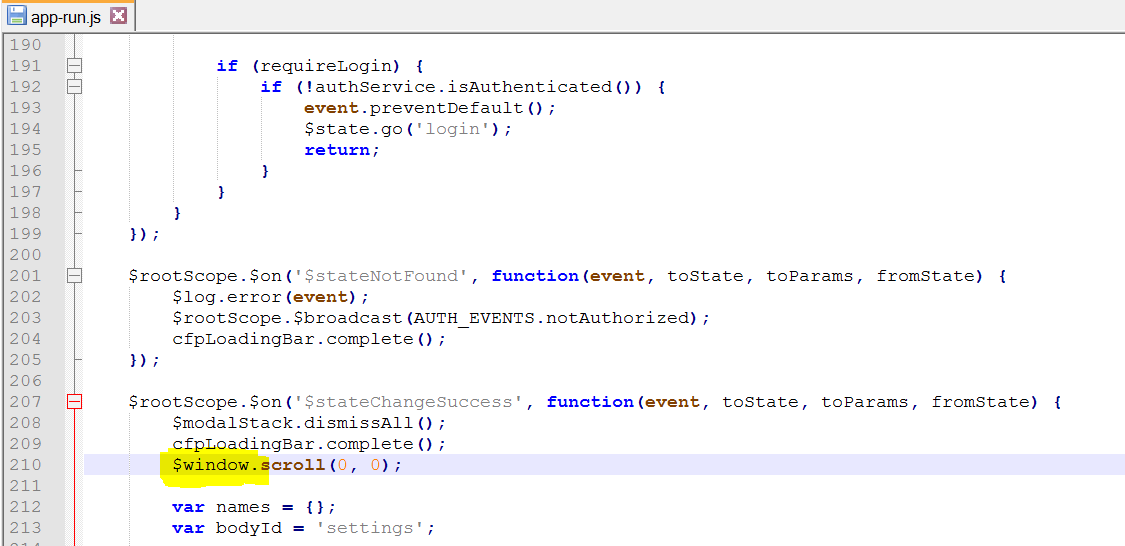
- Insert a small code snippet (hack) in this file
- While tests are executed, coverage info is stored in the browser's local storage
- To make sure this coverage info is saved permanently elsewhere before the local storage is flushed, the inserted code snippet sends it to a separate server that then puts all the content in a json file to be processed later
- The code snippet is triggered on every page reload and close
- By default, "window.__coverage__" object in local storage has all the coverage info

- The coverage server used here is deployed at https://coverage.monotype.com/ (our organization-wide internal coverage server)
- You can replace the same with the details of your coverage server, and the coverage API should store the content in a json file
if(window.sessionStorage) { window.onunload = function() { if(window.__coverage__) { console.log("UNLOAD TRIGGERED"); var xhttp = new XMLHttpRequest(); xhttp.open("POST","https://coverage.monotype.com/api/coverage?path=C:/coverage/cs-sams-ui",false); xhttp.setRequestHeader("Content-type", "application/json"); xhttp.send(JSON.stringify(window.__coverage__)); } };}
- Install the required project dependencies
- npm install
- Install istanbul package from npm
- npm install istanbul -g

- Now let's instrument the base code and keep the entire instrumented code in "inst" directory at root location of project
- istanbul instrument . -o inst --complete-copy

- The "complete-copy" parameter copies the un-instrumentable files as-it-is to the "inst" folder, eg. css and html files. Normally, all instrumented JS files along with non-JS files should now be in our "inst" folder.
- In case, the source code is written in ES6 (the new Javascript implementation), use the following command instead
- istanbul instrument . -o inst --complete-copy --es-modules
- Change your current directory to "inst" and start the UI server (following are project-specific commands)
- SET SAMS_UI_HOST=0.0.0.0
- SET SAMS_UI_PORT=3010
- npm run staging-server

- This should deploy your instrumented code on http://localhost:3010/
- Open your favorite browser and try to access the same
- Just to verify if everything is fine, open the developer tools and in console type "window.__coverage__"
- Ideally, this should display the coverage info captured till the moment in a json string

- Also, "UNLOAD TRIGGERED" will be displayed in console each time you reload your web app. This was a part of "hack" we used in one of the earlier steps (if you would have noticed)

- Now, you can either run tests manually on this server or trigger automated tests
- After all the tests have executed, go to the coverage server that would have collected all coverage info in several json files
- Run the following command to obtain an aggregated HTML/LCOV report from these json files
- istanbul report
- By default, this command assumes that all json files are in "coverage" folder of current directory
- After the above command has run successfully, a new "lcov-report" folder is created within the "coverage" folder

- Navigate to it and open the "index.html" file to view the overall stats

- You can navigate to each file and see individual stats too

BINGO!!!
Disadvantages
Istanbul's report does not include files which were not touched at all. As such, if no code was covered by your tests from some of the files, Istanbul won't include them in the report and thus show the percentage accordingly.
As a workaround, you can use the "sloc" npm package to obtain the number of lines of code in your source files.
That's all for now, thank you for reading through this post. Please don't forget to provide your valuable feedback in the comments section below. I will be more than happy to answer your queries, and probably update this post based on the great suggestions you might have.
SHaRiNG iS CaRiNG !$!$!$!